Map the Block › Data › Environment & hazards
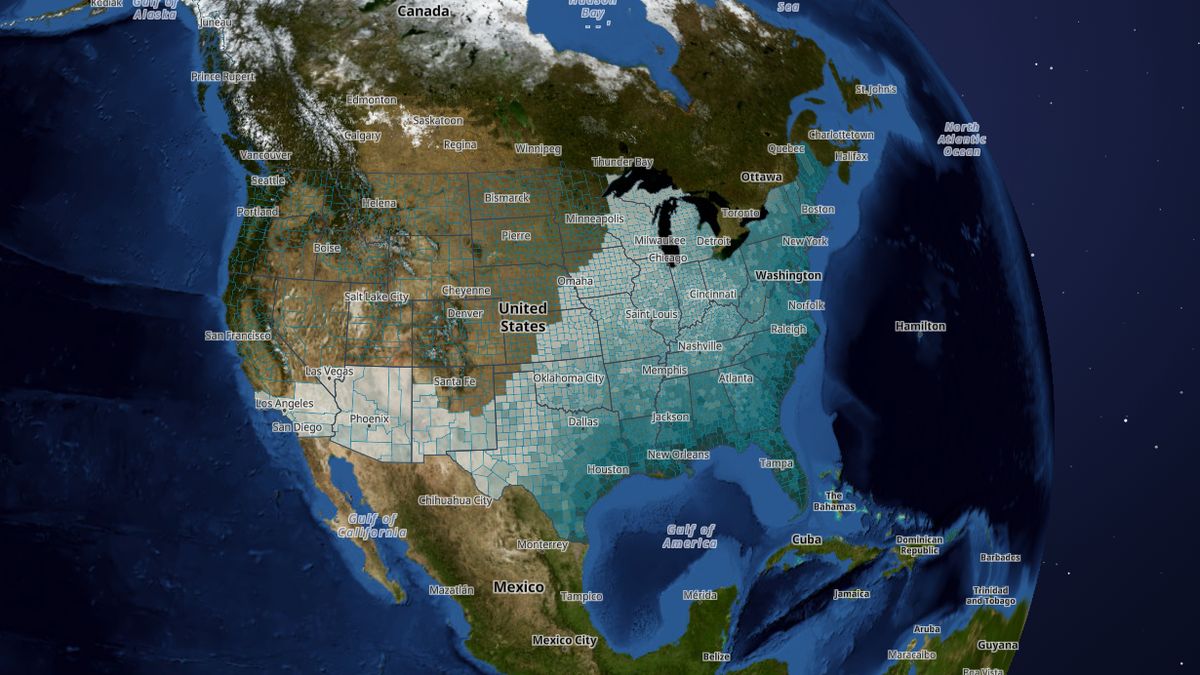
Hurricane Risk by County
Which counties have the highest long-run hurricane risk.
2 counties share the top score of 100 out of 100 on FEMA's National Risk Index: Miami-Dade County, Florida, Harris County, Texas.
 Open the live map →
🌀Highest-scoring counties
| County | Fema hurricane risk score (0-100) |
|---|---|
| Miami-Dade County, Florida | 100 |
| Harris County, Texas | 100 |
| Palm Beach County, Florida | 99.9 |
| Lee County, Florida | 99.9 |
| Broward County, Florida | 99.8 |
| Jefferson Parish, Louisiana | 99.8 |
| Orleans Parish, Louisiana | 99.7 |
| Brevard County, Florida | 99.7 |
| Collier County, Florida | 99.7 |
| Charleston County, South Carolina | 99.6 |
🌊States with the most top-5% counties
🔎About this data
FEMA's long-run hurricane risk score, compared with other U.S. counties.
Source: FEMA National Risk Index v1.20 (December 2025), county scores
Coverage: Nationwide (counties)
Single source: FEMA's recorded tornado events for Oklahoma, Kansas and Alabama compared with NOAA storm records (moderate agreement, as expected for a long-run model). FEMA's scores are modelled estimates, so this layer is labelled single source.
⬇️Download this data
The first 25 rows of the full file, with all 15 columns, so you can see exactly what you get.
Sample CSVA free key gives you 1,000 calls a month: look up any county, state or address and get every figure on this page.
Get a free keyAll 3,222 rows as CSV or JSON, refreshed when the map updates. Included with the Data API from $19 a month (commercial use from $79).
See plansDataset hazards · full file at /api/v1/bulk/hazards.csv with your key · see the data terms.
💬Questions and answers
Which county has the highest hurricane risk?
2 counties share the top score of 100 out of 100 on FEMA's National Risk Index: Miami-Dade County, Florida, Harris County, Texas.
Which state has the most high-risk counties?
Florida has the most counties in the top 5% (35 of the 122 counties scoring 95 or more).
What does the score mean?
FEMA's National Risk Index scores each county from 0 to 100 compared with all other U.S. counties: a score of 95 means the county's expected long-run losses are higher than 95% of counties. It is a model of risk over many years, not a forecast.
Where does this data come from?
FEMA National Risk Index v1.20 (December 2025), county scores. Coverage: Nationwide (counties).
Is the map free to use?
Yes. Map the Block is free, with no ads or paywall. You may quote figures with credit to Map the Block (maptheblock.com); for bulk or commercial use there is a Data API.
🧭More maps like this
Keep the map free. Map the Block has no ads and no paywall. Donations pay for the server and the data work.
Numbers computed from the live map data on October 18, 2026. Free to quote with credit to “Map the Block (maptheblock.com)”; see reuse terms.