Map the Block › Data › Environment & hazards
Radon Map by County: EPA Radon Zones
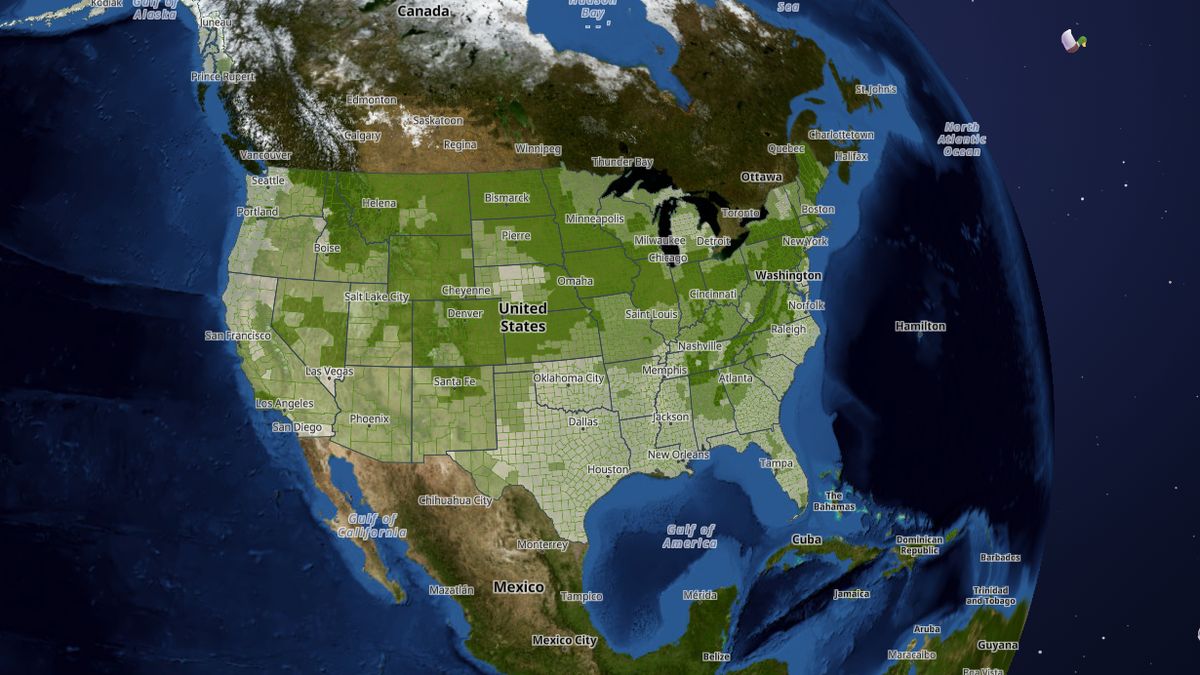
Which counties are in the EPA's highest radon zone, where homes are most likely to have high radon.
In 2 states every county is in EPA Zone 1, the highest predicted radon: Iowa, North Dakota. Nationwide, 1,074 of 3,144 counties are Zone 1.
 Open the live map →
☢️Share of counties in Zone 1, by state
🔎About this data
EPA's county radon zones from its 1993 map: Zone 1 counties have the highest predicted average indoor radon. Any home can have high radon, whatever the zone; the only way to know is to test.
Source: U.S. EPA Map of Radon Zones (county list re-posted June 2024)
Coverage: 50 states + DC (not Puerto Rico)
How it was checked: All 99 Iowa counties are Zone 1, as Iowa's health department says; zone totals (1,074 / 1,032 / 1,038) are within 0.2% of EPA's list after matching names to today's counties.
⬇️Download this data
The first 25 rows of the full file, with all 27 columns, so you can see exactly what you get.
Sample CSVA free key gives you 1,000 calls a month: look up any county, state or address and get every figure on this page.
Get a free keyAll 3,222 rows as CSV or JSON, refreshed when the map updates. Included with the Data API from $19 a month (commercial use from $79).
See plansDataset environment · full file at /api/v1/bulk/environment.csv with your key · see the data terms.
💬Questions and answers
Which states have the most radon?
In 2 states every county is in EPA Zone 1, the highest predicted radon: Iowa, North Dakota. Nationwide, 1,074 of 3,144 counties are Zone 1.
Does a low radon zone mean my home is safe?
No. EPA zones predict county averages; any home can have high radon whatever the zone. The only way to know is to test your home.
Where does this data come from?
U.S. EPA Map of Radon Zones (county list re-posted June 2024). Coverage: 50 states + DC (not Puerto Rico).
Is the map free to use?
Yes. Map the Block is free, with no ads or paywall. You may quote figures with credit to Map the Block (maptheblock.com); for bulk or commercial use there is a Data API.
🧭More maps like this
Keep the map free. Map the Block has no ads and no paywall. Donations pay for the server and the data work.
Numbers computed from the live map data on October 18, 2026. Free to quote with credit to “Map the Block (maptheblock.com)”; see reuse terms.