Map the Block › Data › Environment & hazards
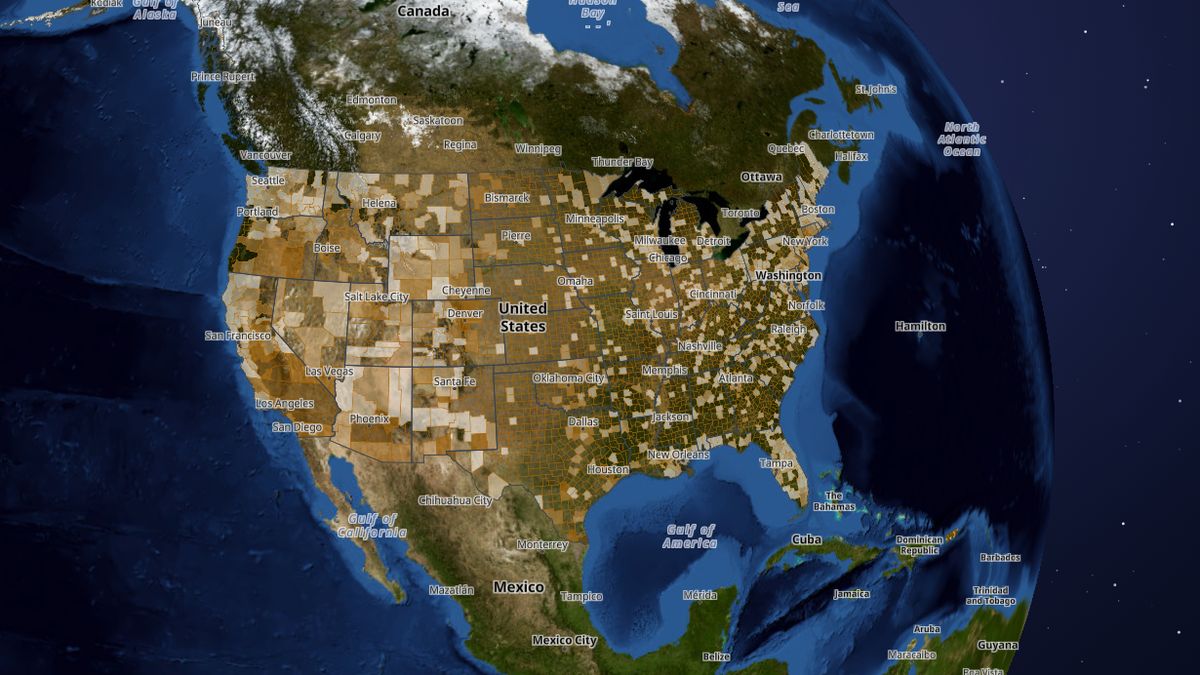
Unhealthy Air Quality Days by County (2024)
Which counties had the most days with air unhealthy to breathe in 2024, from EPA monitors.
Riverside County, California has the most, 147 unhealthy air days in 2024, followed by San Bernardino County, California (144) and Los Angeles County, California (133).
 Open the live map →
🌫️Counties with the most unhealthy air days in 2024
🔎About this data
Number of days in 2024 when the county's Air Quality Index was above 100 (unhealthy for sensitive groups or worse), from EPA's air monitors. The popup adds EPA's official 3-year design values for fine particles and ozone. Counties without a monitor are left grey, not counted as clean.
Source: U.S. EPA AirData, annual AQI by county 2024; EPA Air Quality Design Values 2023-2025 (June 2026)
Coverage: About 990 counties with EPA air monitors (others grey)
How it was checked: Compared with EPA's separate 2023-2025 ozone design values: counties with more unhealthy days have higher ozone values (rank correlation 0.63 over 574 counties), and 99% of the 96 counties over the ozone standard had at least one unhealthy day in 2024.
⬇️Download this data
The first 25 rows of the full file, with all 27 columns, so you can see exactly what you get.
Sample CSVA free key gives you 1,000 calls a month: look up any county, state or address and get every figure on this page.
Get a free keyAll 3,222 rows as CSV or JSON, refreshed when the map updates. Included with the Data API from $19 a month (commercial use from $79).
See plansDataset environment · full file at /api/v1/bulk/environment.csv with your key · see the data terms.
💬Questions and answers
Which county has the most unhealthy air days in 2024?
Riverside County, California has the most, 147 unhealthy air days in 2024, followed by San Bernardino County, California (144) and Los Angeles County, California (133).
Where does this data come from?
U.S. EPA AirData, annual AQI by county 2024; EPA Air Quality Design Values 2023-2025 (June 2026). Coverage: About 990 counties with EPA air monitors (others grey).
Is the map free to use?
Yes. Map the Block is free, with no ads or paywall. You may quote figures with credit to Map the Block (maptheblock.com); for bulk or commercial use there is a Data API.
🧭More maps like this
Keep the map free. Map the Block has no ads and no paywall. Donations pay for the server and the data work.
Numbers computed from the live map data on October 18, 2026. Free to quote with credit to “Map the Block (maptheblock.com)”; see reuse terms.