Map the Block › Data › Crime
Homicide Deaths by County (CDC Death Records)
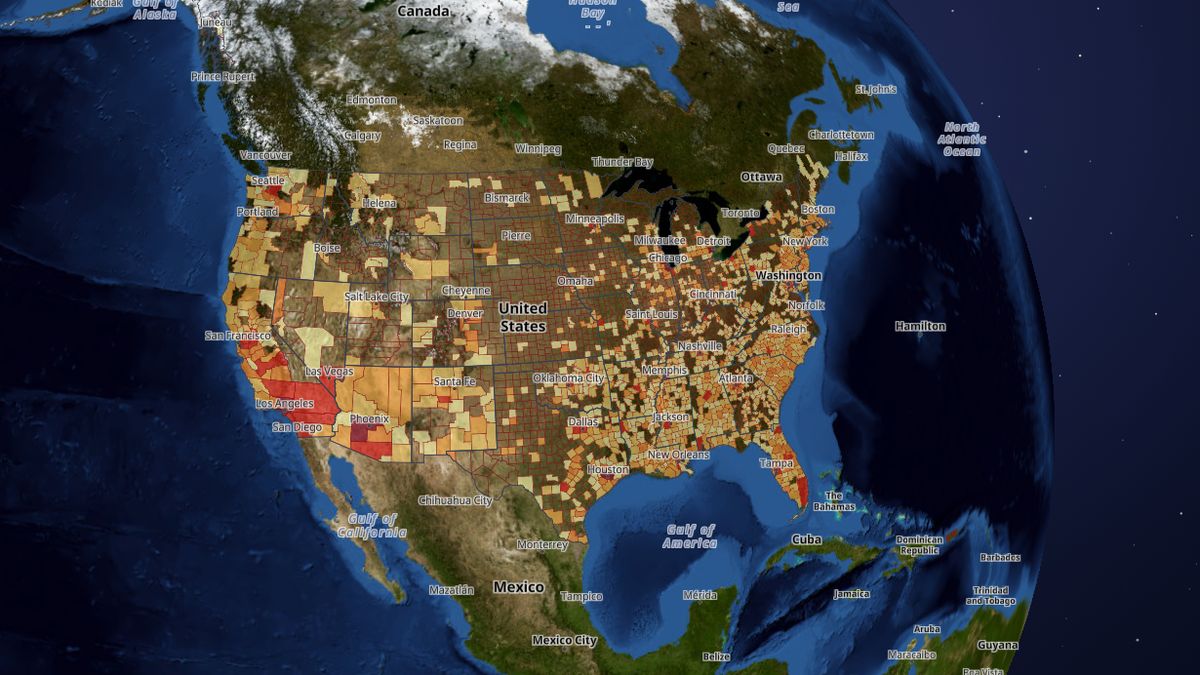
Homicide deaths per year in each county, from death certificates rather than police reports.
Cook County, Illinois has the most, 845 homicide deaths per year, followed by Los Angeles County, California (643) and Harris County, Texas (488).
 Open the live map →
🕯️Counties with the most homicide deaths per year
🔎About this data
Deaths ruled homicides on death certificates (U.S. CDC, National Center for Health Statistics), per year on average for 2016-2022, by the county where the person lived. A coroner or medical examiner rules every death, so this count does not depend on how police classify a case. Compare it with murders reported by police (FBI, 2021-2025): the years differ, and homicides peaked in 2020-2022, so small differences are expected; a large, lasting gap is worth asking your police department about. The CDC does not publish counties with fewer than 10 homicide deaths in the 7 years, and has no county figures for Puerto Rico.
Source: U.S. CDC National Center for Health Statistics (National Vital Statistics System) mortality files, as published by County Health Rankings & Roadmaps 2025 (University of Wisconsin Population Health Institute)
Coverage: Nationwide: 1,425 counties with 10 or more homicide deaths in 2016-2022; smaller counties are not published
How it was checked: Philadelphia: 411 a year here vs 411 from the city's own yearly homicide counts for 2016-2022. National sum of published counties (20,671 a year) is about 95% of the CDC national total, the rest being small counties the CDC does not publish.
⬇️Download this data
The first 25 rows of the full file, with all 28 columns, so you can see exactly what you get.
Sample CSVA free key gives you 1,000 calls a month: look up any county, state or address and get every figure on this page.
Get a free keyAll 3,222 rows as CSV or JSON, refreshed when the map updates. Included with the Data API from $19 a month (commercial use from $79).
See plansDataset crime · full file at /api/v1/bulk/crime.csv with your key · see the data terms.
💬Questions and answers
Which county has the most homicide deaths per year?
Cook County, Illinois has the most, 845 homicide deaths per year, followed by Los Angeles County, California (643) and Harris County, Texas (488).
Where does this data come from?
U.S. CDC National Center for Health Statistics (National Vital Statistics System) mortality files, as published by County Health Rankings & Roadmaps 2025 (University of Wisconsin Population Health Institute). Coverage: Nationwide: 1,425 counties with 10 or more homicide deaths in 2016-2022; smaller counties are not published.
Is the map free to use?
Yes. Map the Block is free, with no ads or paywall. You may quote figures with credit to Map the Block (maptheblock.com); for bulk or commercial use there is a Data API.
🧭More maps like this
Keep the map free. Map the Block has no ads and no paywall. Donations pay for the server and the data work.
Numbers computed from the live map data on October 18, 2026. Free to quote with credit to “Map the Block (maptheblock.com)”; see reuse terms.