Map the Block › Data › Crime
Car Thefts by County: Map and Rankings
Which counties have the most stolen cars reported to police each year.
Los Angeles County, California has the most, 51,769 car thefts reported per year, followed by Cook County, Illinois (26,904) and Harris County, Texas (25,268).
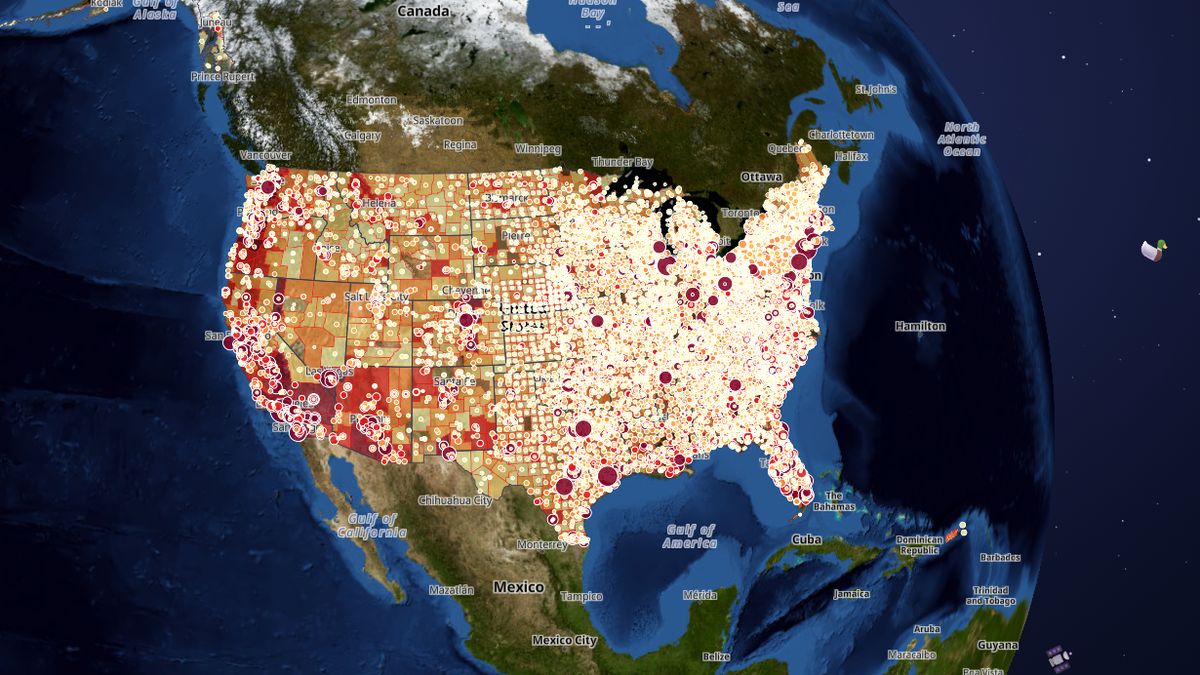 Open the live map →
🚗Counties with the most car thefts reported per year
| County | Car thefts reported per year |
|---|---|
| Los Angeles County, California | 51,769 |
| Cook County, Illinois | 26,904 |
| Harris County, Texas | 25,268 |
| Dallas County, Texas | 19,496 |
| Alameda County, California | 18,857 |
| King County, Washington | 17,862 |
| Philadelphia County, Pennsylvania | 15,410 |
| Bexar County, Texas | 14,233 |
| Clark County, Nevada | 13,806 |
| Maricopa County, Arizona | 13,194 |
🚨States with the most car thefts reported per year
🔎About this data
Most crime never reaches the police, so these numbers are a floor, not the full count. In 2024 only about 3 in 10 property crimes (31%) were reported to police; car thefts are reported more often (75%) (U.S. Justice Department, National Crime Victimization Survey, Criminal Victimization 2024). A low number does not mean an area is safe. FBI-reported offenses for 2021 to 2025 combined: the average per year from every city police department and sheriff in the county. Each agency counts only the years it reported all 12 months; incomplete years (such as many large cities in 2021, when the FBI changed reporting systems) are left out. Agencies covering several counties are counted in the county where their city is. Faded counties: under 60% of residents covered (under 30%: counts are partial, see the popup note). Unshaded: no police agency there reported a full year. Counts reflect reported crime only (about half of violent crime is never reported). Shading is the raw count, so bigger counties are usually darker; the popup also gives the rate per 100,000. Where the FBI file leaves a county empty or thin, official state figures fill it (New York DCJS for the five NYC boroughs, Georgia GBI, Puerto Rico Police); the popup names the source.
Source: FBI Uniform Crime Reporting 2021-2025 (agency level, Return A), averaged and summed by county by Map the Block; Census population
Coverage: Nationwide (3,222 counties)
How it was checked: County totals add up to 91.2% of all FBI-reported violent crime (the rest is state police and campus agencies, which have no resident population); multi-county agencies placed by their city's location.
⬇️Download this data
The first 25 rows of the full file, with all 28 columns, so you can see exactly what you get.
Sample CSVA free key gives you 1,000 calls a month: look up any county, state or address and get every figure on this page.
Get a free keyAll 3,222 rows as CSV or JSON, refreshed when the map updates. Included with the Data API from $19 a month (commercial use from $79).
See plansDataset crime · full file at /api/v1/bulk/crime.csv with your key · see the data terms.
💬Questions and answers
Which county has the most car thefts reported per year?
Los Angeles County, California has the most, 51,769 car thefts reported per year, followed by Cook County, Illinois (26,904) and Harris County, Texas (25,268).
How many car thefts reported per year are there in the United States?
The counties on this map add up to 875,401 car thefts reported per year. California has the most (158,715), then Texas (97,710). Counts are raw numbers, so large counties rank highest; the map popup also gives the rate where one is published.
Where does this data come from?
FBI Uniform Crime Reporting 2021-2025 (agency level, Return A), averaged and summed by county by Map the Block; Census population. Coverage: Nationwide (3,222 counties).
Is the map free to use?
Yes. Map the Block is free, with no ads or paywall. You may quote figures with credit to Map the Block (maptheblock.com); for bulk or commercial use there is a Data API.
🧭More maps like this
Keep the map free. Map the Block has no ads and no paywall. Donations pay for the server and the data work.
Numbers computed from the live map data on October 18, 2026. Free to quote with credit to “Map the Block (maptheblock.com)”; see reuse terms.