Map the Block › Data › Public safety
Homelessness Count by Area (HUD 2025)
How many people were homeless on one night in January 2025, in every HUD Continuum of Care area.
HUD's 2025 Point-in-Time count found 745,652 people homeless on one night in late January 2025, 266,320 of them unsheltered.
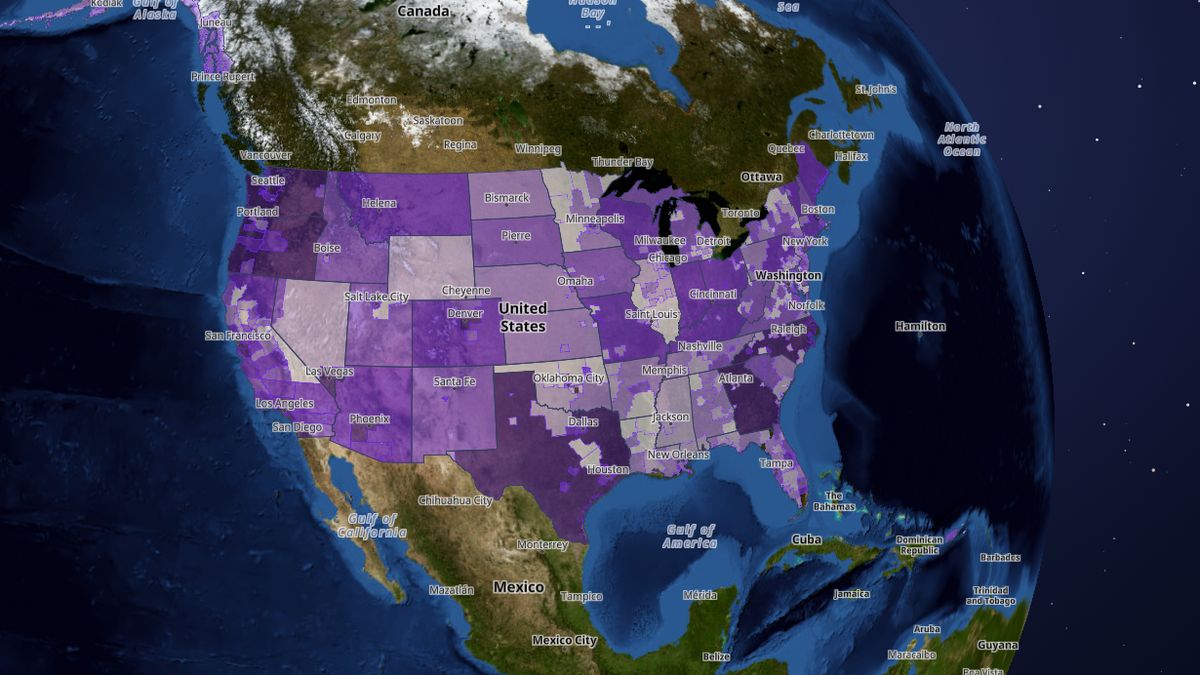 Open the live map →
🏠Areas with the most people homeless
| Area | People | Unsheltered | Per 10,000 residents |
|---|---|---|---|
| New York City CoC | 125,683 | 4,673 | 148.1 |
| Los Angeles City & County CoC | 67,777 | 44,415 | 75.0 |
| Seattle/King County CoC | 16,936 | 9,810 | 73.9 |
| Metropolitan Denver CoC | 10,774 | 2,149 | 33.0 |
| San Jose/Santa Clara City & County CoC | 10,711 | 7,472 | 56.3 |
| Massachusetts Balance of State CoC | 10,539 | 502 | 36.0 |
| Portland, Gresham/Multnomah County CoC | 10,526 | 6,912 | 131.3 |
| San Diego City and County CoC | 9,905 | 5,714 | 30.1 |
| Phoenix, Mesa/Maricopa County CoC | 9,734 | 5,207 | 21.3 |
| Oakland, Berkeley/Alameda County CoC | 9,262 | 6,343 | 56.2 |
💚States with the most people homeless
🔎About this data
HUD's Point-in-Time count: people sleeping in shelters or outside on one night in late January 2025, counted by each local Continuum of Care. Methods vary by area. Need help tonight? See 'Homelessness: get help'.
Source: U.S. Department of Housing and Urban Development (HUD), 2025 Point-in-Time and Housing Inventory Counts by Continuum of Care
Coverage: Nationwide
How it was checked: All 386 areas add up exactly to HUD's published national total (745,652); state totals and city reports also checked.
💬Questions and answers
How many people are homeless in the United States?
HUD's 2025 Point-in-Time count found 745,652 people homeless on one night in late January 2025, 266,320 of them unsheltered.
Which area has the most homeless people?
New York City CoC (125,683 people), then Los Angeles City & County CoC and Seattle/King County CoC.
Where can someone get help tonight?
Call or text 211, or visit 211.org, to reach local shelter and housing help.
Where does this data come from?
U.S. Department of Housing and Urban Development (HUD), 2025 Point-in-Time and Housing Inventory Counts by Continuum of Care. Coverage: Nationwide.
Is the map free to use?
Yes. Map the Block is free, with no ads or paywall. You may quote figures with credit to Map the Block (maptheblock.com); for bulk or commercial use there is a Data API.
🧭More maps like this
Keep the map free. Map the Block has no ads and no paywall. Donations pay for the server and the data work.
Numbers computed from the live map data on October 18, 2026. Free to quote with credit to “Map the Block (maptheblock.com)”; see reuse terms.