Map the Block › Data › Environment & hazards
Toxic Chemical Releases Map (EPA TRI 2024)
Every factory, mine and plant that reported releasing listed chemicals to the EPA for 2024, and how many pounds.
The map shows 21,482 facilities reporting chemical releases. Texas has the most (1,950), then Ohio (1,269) and California (1,075).
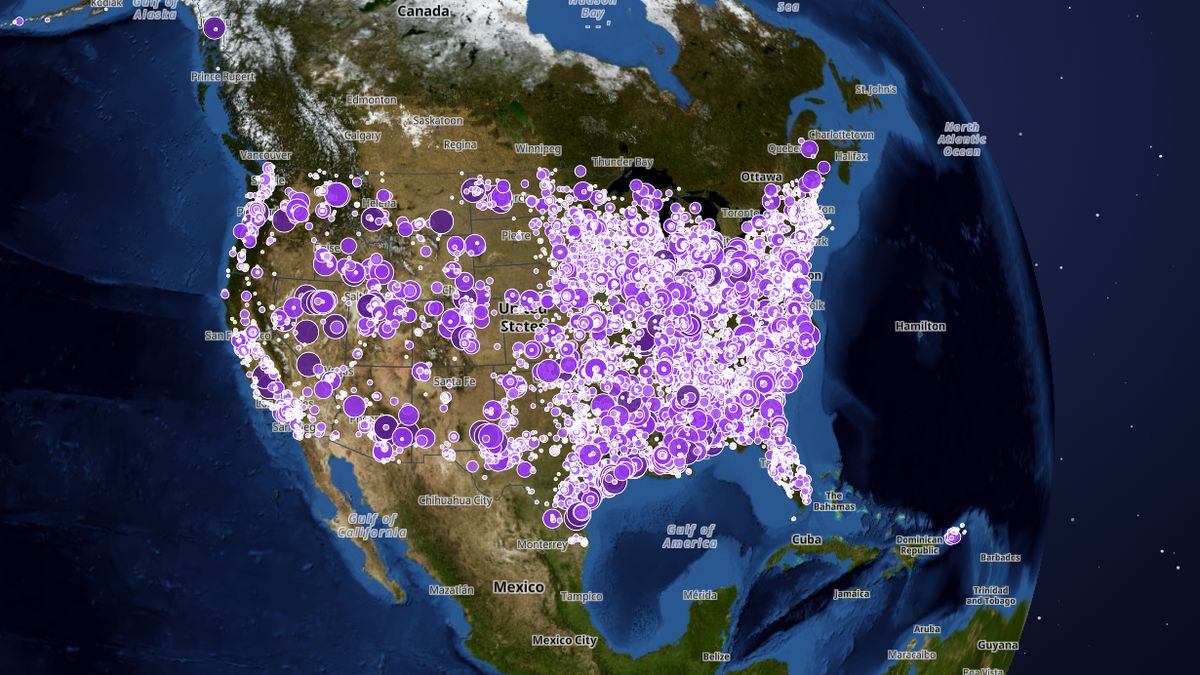 Open the live map →
🏭Pounds by industry
☣️Largest reported releases
| Facility | Where | Industry | Pounds (2024) |
|---|---|---|---|
| RED DOG OPERATIONS | Kotzebue, AK | Metal Mining | 723,889,153 |
| KENNECOTT UTAH COPPER MINE CONCENTRATORS & POWER PLANT | Bingham Canyon, UT | Metal Mining | 192,700,174 |
| HECLA GREENS CREEK MINING CO | Juneau, AK | Metal Mining | 87,578,803 |
| MIDWAY GAS PLANT | Crane, TX | Natural Gas Processing | 73,296,085 |
| ASARCO LLC RAY COMPLEX/ HAYDEN SMELTER & CONCENTRATOR | Hayden, AZ | Primary Metals | 54,999,888 |
| NEVADA GOLD MINES LLC - GOLDSTRIKE MINES INC | Carlin, NV | Metal Mining | 49,060,996 |
| ELEMENTAL ENVIRONMENTAL SOLUTIONS LLC | Arkadelphia, AR | Hazardous Waste | 39,830,070 |
| BASIN ELECTRIC ANTELOPE VALLEY STATION | Beulah, ND | Chemicals | 33,191,278 |
| MONTANA RESOURCES LLC | Butte, MT | Metal Mining | 31,652,802 |
| NEVADA GOLD MINES LLC - CARLIN SOUTH AREA | Carlin, NV | Metal Mining | 28,092,711 |
🧪States with the most facilities reporting chemical releases
🔎About this data
Facilities that reported releases of listed chemicals to EPA's Toxics Release Inventory for 2024: total pounds released on site (air, water, land) and sent off site for disposal. These are amounts the companies reported, mostly under permits, not a measure of health risk. Mines report the most pounds, mostly as waste rock on their own land.
Source: U.S. EPA Toxics Release Inventory, reporting year 2024 (basic data file)
Coverage: Nationwide (incl. Puerto Rico and territories)
How it was checked: Kentucky: 405 facilities vs 404 in Kentucky's own 2024 TRI report, and the two facilities checked (North American Stainless, Phoenix Paper Wickliffe) match to the pound. National total 3.29 billion lb from 21,482 facilities vs EPA's latest National Analysis (2023): 3.3 billion lb, 21,000+ facilities.
💬Questions and answers
How many facilities reporting chemical releases are there in the United States?
The map shows 21,482 facilities reporting chemical releases. Texas has the most (1,950), then Ohio (1,269) and California (1,075).
Which facility reported the most chemical releases?
RED DOG OPERATIONS in Kotzebue, AK reported 723,889,153 pounds for 2024, the most on the map. Mines lead because waste rock kept on their own land counts as a release; reported amounts are not a measure of health risk.
Where does this data come from?
U.S. EPA Toxics Release Inventory, reporting year 2024 (basic data file). Coverage: Nationwide (incl. Puerto Rico and territories).
Is the map free to use?
Yes. Map the Block is free, with no ads or paywall. You may quote figures with credit to Map the Block (maptheblock.com); for bulk or commercial use there is a Data API.
🧭More maps like this
Keep the map free. Map the Block has no ads and no paywall. Donations pay for the server and the data work.
Numbers computed from the live map data on October 23, 2026. Free to quote with credit to “Map the Block (maptheblock.com)”; see reuse terms.