Map the Block › Data › Politics
Federal Contract Spending by State (FY2025)
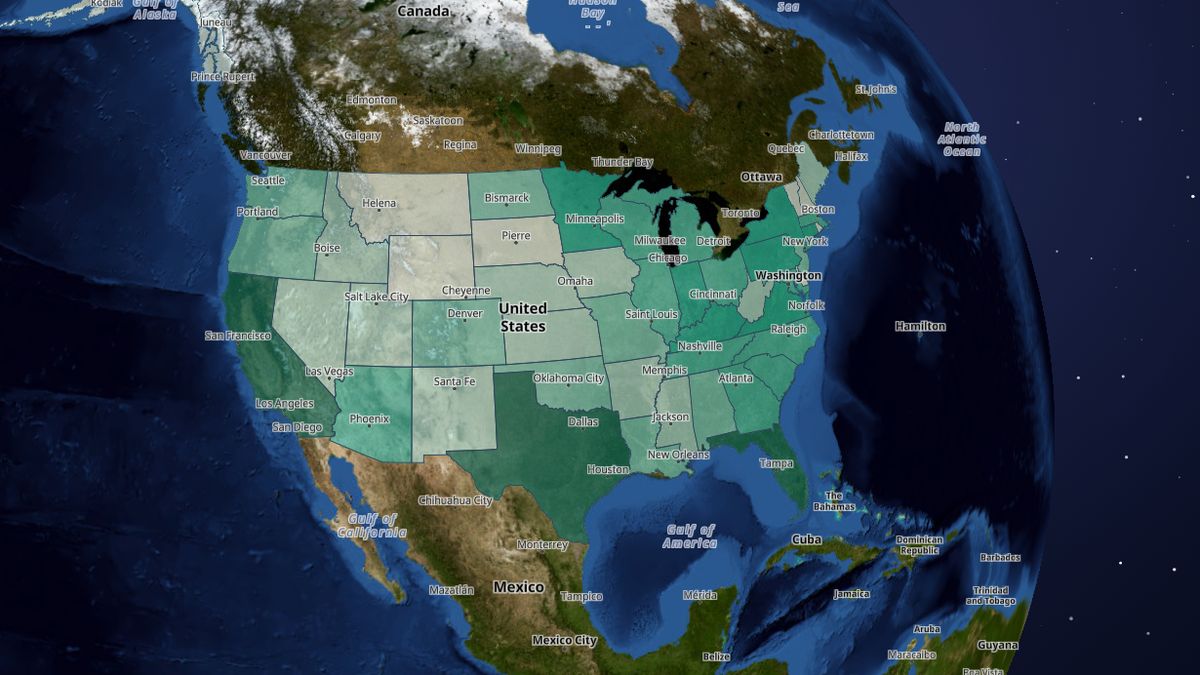
How much the federal government spent on contracts performed in each state in fiscal year 2025, from USAspending.
Virginia ($120.6 billion), then Texas ($86.4 billion) and California ($62.0 billion). All states and DC together come to $739.6 billion. These are raw totals, so big states rank highest.
 Open the live map →
🛰️States with the most federal contract spending
📝Federal contract spending per resident
💵Every state
| State | Total | Per resident |
|---|---|---|
| Virginia | $120.6 billion | $13,851 |
| Texas | $86.4 billion | $2,861 |
| California | $62.0 billion | $1,579 |
| Maryland | $39.7 billion | $6,395 |
| Connecticut | $35.1 billion | $9,695 |
| Florida | $32.4 billion | $1,447 |
| District of Columbia | $31.4 billion | $46,123 |
| Pennsylvania | $26.9 billion | $2,070 |
| Arizona | $23.3 billion | $3,164 |
| Massachusetts | $19.3 billion | $2,744 |
| Alabama | $18.1 billion | $3,567 |
| Colorado | $16.1 billion | $2,747 |
| Washington | $15.8 billion | $2,024 |
| Missouri | $14.0 billion | $2,257 |
| New Mexico | $13.5 billion | $6,362 |
| Illinois | $12.4 billion | $979 |
| New York | $12.1 billion | $608 |
| Georgia | $11.6 billion | $1,065 |
| Tennessee | $11.0 billion | $1,550 |
| Kentucky | $10.4 billion | $2,299 |
| Ohio | $9.8 billion | $833 |
| North Carolina | $9.3 billion | $870 |
| New Jersey | $9.3 billion | $999 |
| South Carolina | $8.3 billion | $1,572 |
| Mississippi | $8.0 billion | $2,716 |
| Indiana | $7.0 billion | $1,022 |
| Oklahoma | $6.8 billion | $1,688 |
| Michigan | $6.6 billion | $656 |
| Wisconsin | $6.3 billion | $1,059 |
| Hawaii | $5.5 billion | $3,816 |
| Utah | $5.2 billion | $1,540 |
| Louisiana | $4.8 billion | $1,031 |
| Nevada | $4.0 billion | $1,266 |
| Idaho | $3.9 billion | $2,041 |
| Maine | $3.9 billion | $2,830 |
| Alaska | $3.9 billion | $5,236 |
| Iowa | $3.6 billion | $1,125 |
| Kansas | $3.6 billion | $1,215 |
| New Hampshire | $2.9 billion | $2,089 |
| Minnesota | $2.5 billion | $434 |
| Oregon | $2.1 billion | $489 |
| West Virginia | $1.9 billion | $1,056 |
| Nebraska | $1.3 billion | $640 |
| Arkansas | $1.3 billion | $414 |
| Montana | $1.1 billion | $1,026 |
| Rhode Island | $906 million | $822 |
| Vermont | $877 million | $1,356 |
| North Dakota | $821 million | $1,046 |
| South Dakota | $804 million | $886 |
| Wyoming | $497 million | $853 |
| Delaware | $368 million | $360 |
🔎About this data
Every federal award obligated in fiscal year 2025 with a place of performance in the state, as reported on USAspending.gov: grants (to governments and others), contracts, and direct payments to people such as Social Security and Medicare. Loans are left out. Contracts are counted where the work is done, which can differ from where the money ends up. Direct payments are counted where the paying office is, not where people live: Medicare and insurer payments land in states with big claims processors or insurers (North Dakota, Minnesota, Kentucky, Connecticut, Indiana), so those states look far higher than they are and others look lower. Compare grants and contracts between states; treat the direct-payment line with care.
Source: USAspending.gov API, spending_by_geography, place of performance, FY2025 (Oct 2024 - Sep 2025)
Coverage: All 50 states and DC
How it was checked: States + DC hold 97% of all FY2025 grant dollars, 95% of contracts and 99% of direct payments; the rest is territories, overseas and awards with no state recorded.
💬Questions and answers
Which state has the most federal contract spending?
Virginia ($120.6 billion), then Texas ($86.4 billion) and California ($62.0 billion). All states and DC together come to $739.6 billion. These are raw totals, so big states rank highest.
Which state has the most federal contract spending per resident?
District of Columbia, at $46,123, then Virginia ($13,851) and Connecticut ($9,695). Per-resident figures use the Census ACS 2020-2024 population.
Where does this data come from?
USAspending.gov API, spending_by_geography, place of performance, FY2025 (Oct 2024 - Sep 2025). Coverage: All 50 states and DC.
Is the map free to use?
Yes. Map the Block is free, with no ads or paywall. You may quote figures with credit to Map the Block (maptheblock.com); for bulk or commercial use there is a Data API.
🧭More maps like this
Keep the map free. Map the Block has no ads and no paywall. Donations pay for the server and the data work.
Numbers computed from the live map data on October 23, 2026. Free to quote with credit to “Map the Block (maptheblock.com)”; see reuse terms.