Map the Block › Data › Politics
State Corporate Income Tax by State (FY2025)
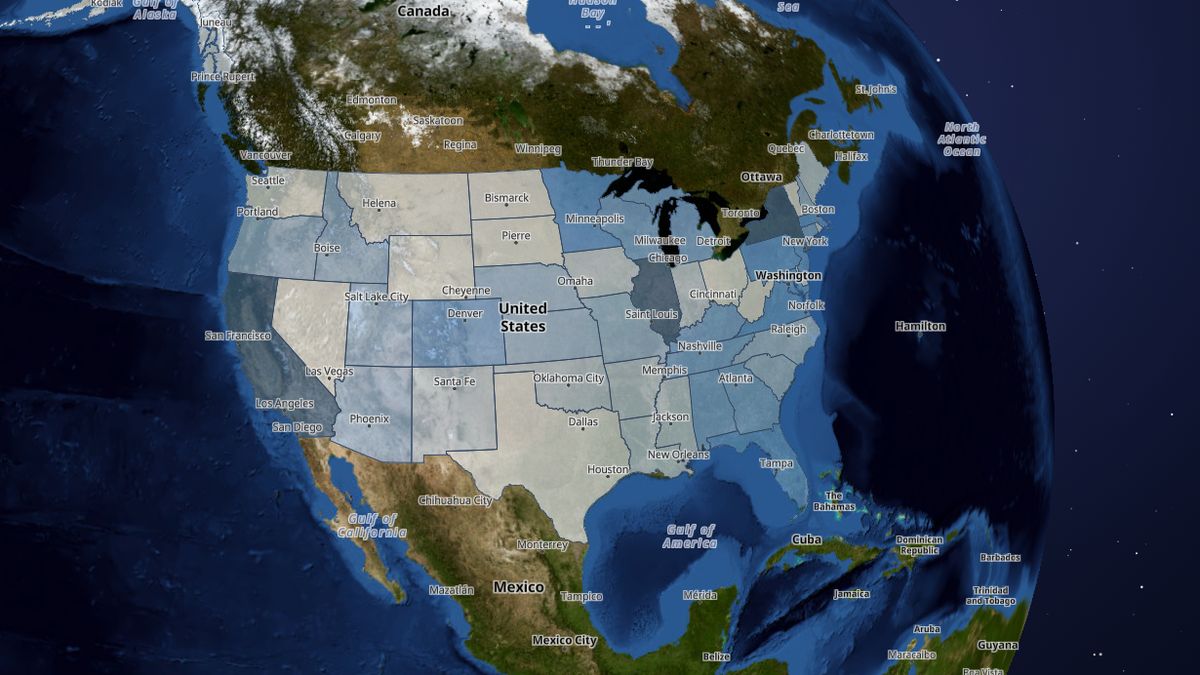
How much corporate income tax each state collected in fiscal year 2025.
California ($39.4 billion), then New York ($26.8 billion) and Illinois ($12.4 billion). All states and DC together come to $164.9 billion. These are raw totals, so big states rank highest.
 Open the live map →
🏢States with the most corporate income tax
🧾Corporate income tax per resident
💵Every state
| State | Total | Per resident |
|---|---|---|
| California | $39.4 billion | $1,003 |
| New York | $26.8 billion | $1,349 |
| Illinois | $12.4 billion | $978 |
| New Jersey | $8.4 billion | $903 |
| Massachusetts | $6.4 billion | $903 |
| Minnesota | $5.9 billion | $1,033 |
| Florida | $5.8 billion | $260 |
| Maryland | $4.9 billion | $787 |
| Virginia | $4.5 billion | $511 |
| Pennsylvania | $4.4 billion | $341 |
| Connecticut | $3.5 billion | $966 |
| Georgia | $3.3 billion | $298 |
| Michigan | $3.1 billion | $304 |
| Wisconsin | $2.7 billion | $460 |
| Tennessee | $2.6 billion | $366 |
| Colorado | $2.4 billion | $402 |
| Kentucky | $2.3 billion | $517 |
| Alabama | $2.1 billion | $418 |
| Arizona | $1.8 billion | $237 |
| Missouri | $1.6 billion | $256 |
| North Carolina | $1.6 billion | $147 |
| Utah | $1.6 billion | $461 |
| Oregon | $1.5 billion | $354 |
| South Carolina | $1.4 billion | $271 |
| Kansas | $1.4 billion | $462 |
| District of Columbia | $1.2 billion | $1,813 |
| New Hampshire | $1.1 billion | $796 |
| Nebraska | $1.1 billion | $543 |
| Idaho | $1.0 billion | $521 |
| Indiana | $894 million | $130 |
| Louisiana | $882 million | $191 |
| New Mexico | $782 million | $369 |
| Iowa | $777 million | $242 |
| Arkansas | $644 million | $211 |
| Oklahoma | $640 million | $159 |
| Delaware | $577 million | $565 |
| Rhode Island | $531 million | $482 |
| Mississippi | $504 million | $171 |
| Hawaii | $411 million | $284 |
| Maine | $410 million | $296 |
| West Virginia | $376 million | $212 |
| Alaska | $365 million | $497 |
| North Dakota | $336 million | $428 |
| Montana | $322 million | $288 |
| Vermont | $286 million | $442 |
| South Dakota | $60 million | $66 |
| Ohio | $176,000 | $0 |
| Nevada | $0 | $0 |
| Texas | $0 | $0 |
| Washington | $0 | $0 |
| Wyoming | $0 | $0 |
🔎About this data
Corporate net income tax collected by the state government in FY2025. A few states tax business gross receipts instead and show $0 here.
Source: U.S. Census Bureau, Annual Survey of State Government Tax Collections (STC), FY2025 (API timeseries/govsstatetax)
Coverage: All 50 states and DC
How it was checked: 50-state sum equals Census's US total to the dollar (DC is listed separately); income tax is 33.7% and general sales 30.9% of the total, matching Pew's FY2025 analysis. State checks: NY income tax $61.2B vs the NY Comptroller's $61.2B; CA $128.7B vs the State Controller's $126.6B General Fund figure; Texas sales + vehicle sales tax within 0.6% of the Comptroller.
💬Questions and answers
Which state has the most corporate income tax?
California ($39.4 billion), then New York ($26.8 billion) and Illinois ($12.4 billion). All states and DC together come to $164.9 billion. These are raw totals, so big states rank highest.
Which state has the most corporate income tax per resident?
District of Columbia, at $1,813, then New York ($1,349) and Minnesota ($1,033). Per-resident figures use the Census ACS 2020-2024 population.
Which states have no corporate income tax?
Nevada, Texas, Washington, Wyoming reported $0, which means the state does not levy it.
Where does this data come from?
U.S. Census Bureau, Annual Survey of State Government Tax Collections (STC), FY2025 (API timeseries/govsstatetax). Coverage: All 50 states and DC.
Is the map free to use?
Yes. Map the Block is free, with no ads or paywall. You may quote figures with credit to Map the Block (maptheblock.com); for bulk or commercial use there is a Data API.
🧭More maps like this
Keep the map free. Map the Block has no ads and no paywall. Donations pay for the server and the data work.
Numbers computed from the live map data on October 23, 2026. Free to quote with credit to “Map the Block (maptheblock.com)”; see reuse terms.