Map the Block › Data › Politics
Public Welfare Spending by State (FY2024)
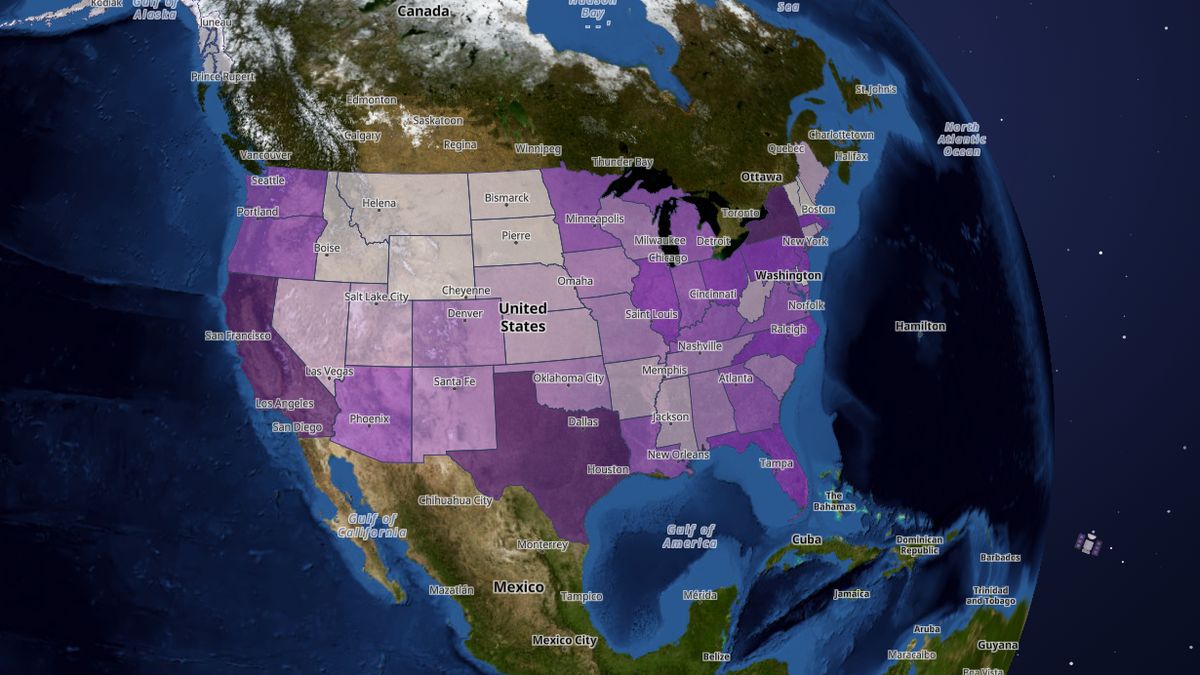
How much each state's governments spent on public welfare, including Medicaid payments, in fiscal year 2024.
California ($183.8 billion), then New York ($112.8 billion) and Texas ($58.5 billion). All states and DC together come to $1.09 trillion. These are raw totals, so big states rank highest.
 Open the live map →
🤝States with the most public welfare spending
💵Public welfare spending per resident
🏛️Every state
| State | Total | Per resident |
|---|---|---|
| California | $183.8 billion | $4,679 |
| New York | $112.8 billion | $5,684 |
| Texas | $58.5 billion | $1,939 |
| Pennsylvania | $44.6 billion | $3,427 |
| Illinois | $42.2 billion | $3,323 |
| Ohio | $41.9 billion | $3,550 |
| Florida | $41.9 billion | $1,868 |
| Massachusetts | $34.4 billion | $4,882 |
| North Carolina | $32.9 billion | $3,066 |
| New Jersey | $28.9 billion | $3,090 |
| Arizona | $26.2 billion | $3,555 |
| Virginia | $26.1 billion | $3,003 |
| Michigan | $26.1 billion | $2,588 |
| Minnesota | $25.1 billion | $4,375 |
| Indiana | $23.0 billion | $3,358 |
| Maryland | $22.0 billion | $3,539 |
| Oregon | $21.1 billion | $4,954 |
| Kentucky | $20.6 billion | $4,550 |
| Washington | $20.2 billion | $2,591 |
| Georgia | $19.2 billion | $1,753 |
| Louisiana | $18.8 billion | $4,081 |
| Wisconsin | $17.8 billion | $3,014 |
| Tennessee | $16.6 billion | $2,351 |
| Missouri | $15.8 billion | $2,558 |
| Colorado | $14.7 billion | $2,516 |
| Oklahoma | $14.6 billion | $3,627 |
| South Carolina | $12.9 billion | $2,433 |
| New Mexico | $10.9 billion | $5,155 |
| Iowa | $10.4 billion | $3,235 |
| Alabama | $9.8 billion | $1,926 |
| Arkansas | $8.7 billion | $2,849 |
| Mississippi | $8.1 billion | $2,752 |
| Nevada | $7.4 billion | $2,312 |
| Utah | $7.2 billion | $2,125 |
| Kansas | $6.9 billion | $2,345 |
| West Virginia | $6.3 billion | $3,521 |
| District of Columbia | $5.8 billion | $8,543 |
| Maine | $5.8 billion | $4,156 |
| Nebraska | $5.2 billion | $2,603 |
| Connecticut | $5.0 billion | $1,374 |
| Rhode Island | $4.6 billion | $4,146 |
| Hawaii | $4.2 billion | $2,938 |
| Delaware | $4.0 billion | $3,894 |
| Idaho | $3.7 billion | $1,934 |
| Alaska | $3.3 billion | $4,516 |
| New Hampshire | $3.1 billion | $2,217 |
| Montana | $3.0 billion | $2,674 |
| Vermont | $2.7 billion | $4,166 |
| North Dakota | $2.2 billion | $2,748 |
| South Dakota | $2.0 billion | $2,187 |
| Wyoming | $1.1 billion | $1,909 |
🔎About this data
Public welfare spending by all governments in the state. Public welfare is mainly Medicaid payments to providers, plus cash assistance and other social services, including the federal share that passes through the state. Census figures for state and local governments combined (police and fire are mostly paid by cities and counties), fiscal year 2024, direct spending including buildings and equipment. Shading is the raw dollar total, so bigger states are darker; the popup has per-resident figures.
Source: U.S. Census Bureau, Annual Survey of State and Local Government Finances (ALFIN), FY2024 (API timeseries/govslocalfin)
Coverage: All 50 states and DC
How it was checked: Every state + DC adds up exactly to Census's US total. State-government federal revenue matches Census's separate State Government Finances release exactly. Police total is 90% of BEA's 2024 national-accounts figure (a broader, calendar-year measure).
💬Questions and answers
Which state has the most public welfare spending?
California ($183.8 billion), then New York ($112.8 billion) and Texas ($58.5 billion). All states and DC together come to $1.09 trillion. These are raw totals, so big states rank highest.
Which state has the most public welfare spending per resident?
District of Columbia, at $8,543, then New York ($5,684) and New Mexico ($5,155). Per-resident figures use the Census ACS 2020-2024 population.
Where does this data come from?
U.S. Census Bureau, Annual Survey of State and Local Government Finances (ALFIN), FY2024 (API timeseries/govslocalfin). Coverage: All 50 states and DC.
Is the map free to use?
Yes. Map the Block is free, with no ads or paywall. You may quote figures with credit to Map the Block (maptheblock.com); for bulk or commercial use there is a Data API.
🧭More maps like this
Keep the map free. Map the Block has no ads and no paywall. Donations pay for the server and the data work.
Numbers computed from the live map data on October 23, 2026. Free to quote with credit to “Map the Block (maptheblock.com)”; see reuse terms.